Storyline
Customer Insight That Actually Matters
Product Designer · UX Designer
Storyline helps organizations find the right problems before they invest in the wrong ones, grounding strategy in customer voice and frameworks like Narrative Architecture. That method already worked in the room. I designed the web and mobile workspace that took the production out of PowerPoint and kept the story usable after the walkthrough.
Problem
The analog product was a facilitated walkthrough. Researchers recorded customer interviews in a podcast-style format, pulled quotes from the recording, tagged and categorized each one in PowerPoint, printed the deck, and cut the cards by hand. Clients then walked the wall together: chapters, headings, Facts and Feelings, pinned in columns.
The method produced real alignment, but it only worked while people were standing in front of the board. After the session there was no way to search a quote, share a finding, or come back to the story. Every engagement ended with the same question: where does this go now? Any update meant reprinting and recutting the whole set.
Process
I sat with the researchers whose job was to turn interviews into that wall, and learned the pipeline end to end. Programs such as Voice of the Student, for partners like College for America and Southern New Hampshire University, already had a working method: chapters and headings, Facts and Feelings, participant context, and a story they would take back to leadership. They did not want a generic research tracker. They wanted the wall, minus the PowerPoint, print, and cut cycle, and a way to keep using the storyline after the client left.
I treated the live boards as the spec rather than a mood board. The columns, Feeling and Fact tags, and chapter structure already existed in the room. The design question was whether that same walk could survive on a screen after people left, instead of inventing a new research tool they would have to relearn.
Solution
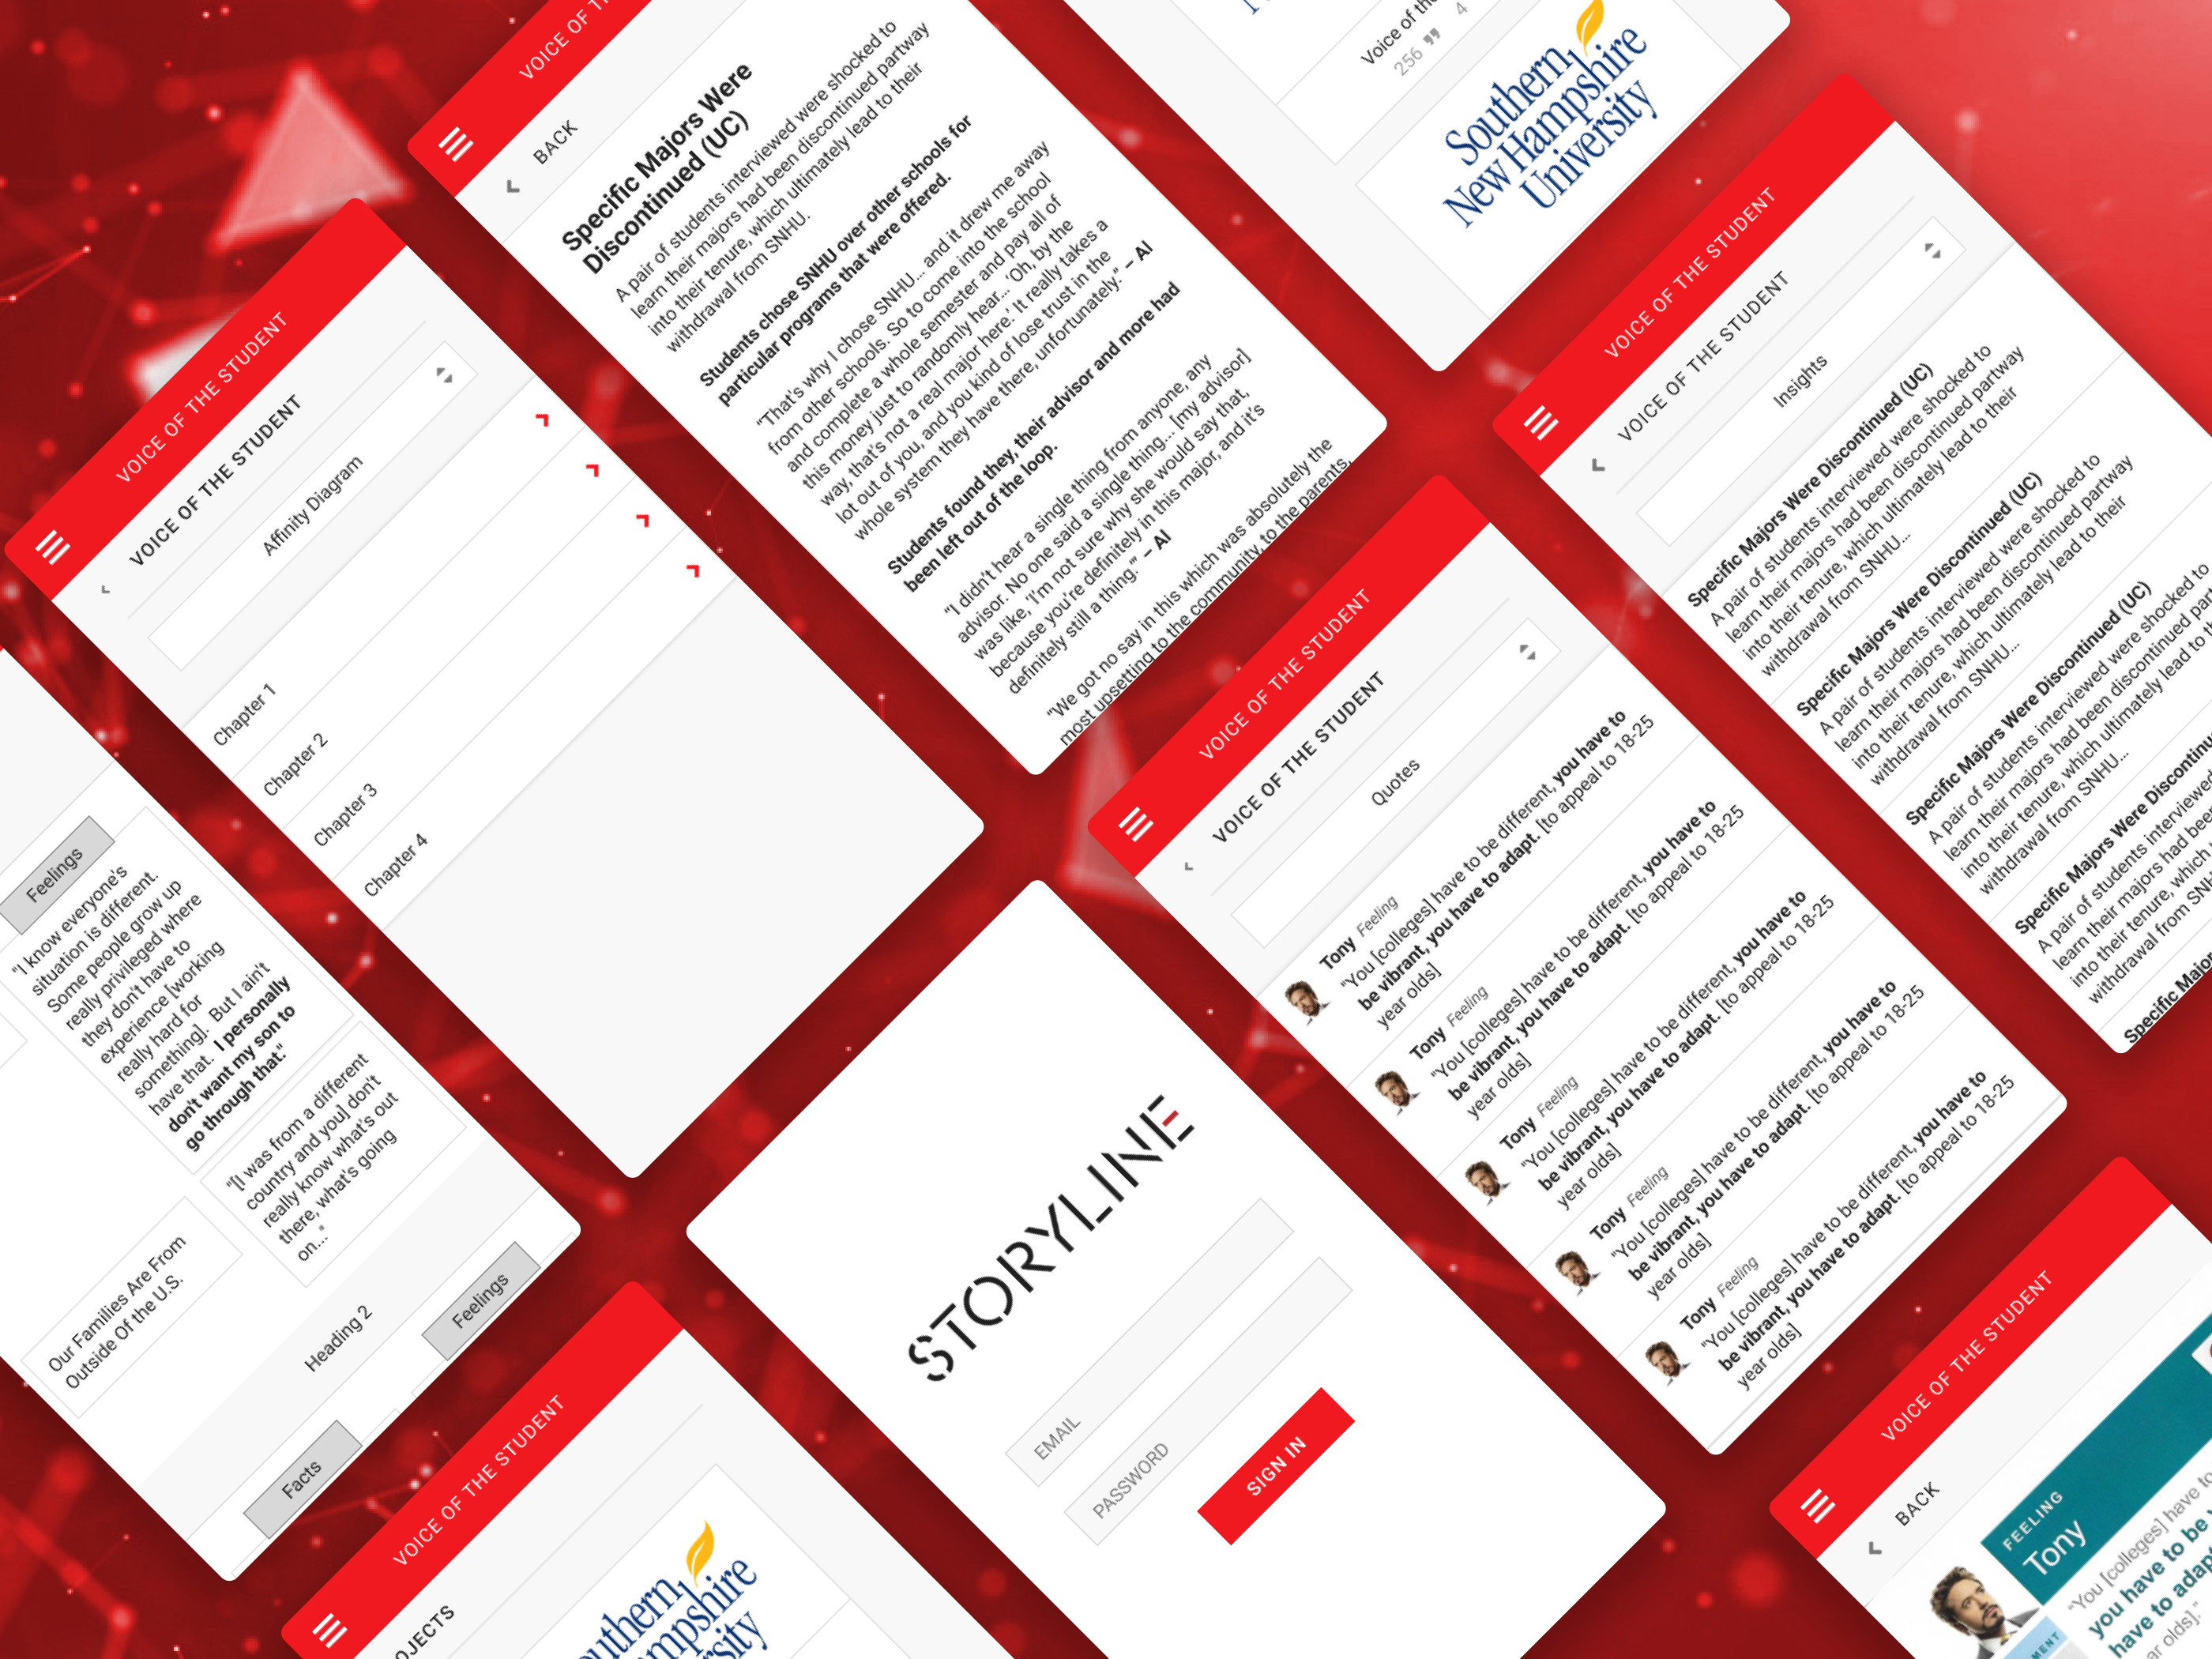
The platform encodes the analog method. Capture a quote once, with the participant and a Feeling or Fact tag, and the card formats itself. I structured the information architecture around how teams already moved from raw voice to structured themes: Diagram, Quotes, Participants, Demographics, and Insights.
Working surfaces stay dense and editorial, built for researchers curating large interview sets. Quote and persona surfaces flip the register: the pull quote and portrait are the hero, so a single voice can stand up in a leadership readout the way a printed card did on the table. Same data, two registers.
Outcomes
Card production moved into the product. Diagram structure, quote libraries, and persona storytelling stay connected, so customer voice is an operational layer teams can return to, not a one-off deck. Clients leave with a living storyline they can search, print, and share, not a photograph of a whiteboard.